Directions
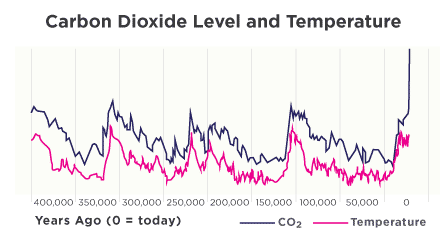
According to the graph, each cycle of global warming and cooling takes place over 100,000 years. The level of CO₂ rises and falls with the temperature. Do you notice any difference in the rate at which the CO₂ level rises and falls?
For instance, look at the first rise in CO₂ level on the graph around 350,000 years ago. It took less than 50,000 years for the level of CO₂ to rise from 180 ppm to about 300 ppm, but way more than 50,000 years for the level of CO₂ to drop again to around 180 ppm. The overall rate of change—how fast something changes—is different for the rise of CO₂ level than it is for the the fall of CO₂ level. See if this is true for the other rises and dips on the graph.