Directions
On a graph, little pieces of information called data come together to form a plot. Each data point is plotted on a precise position on the graph. This position is called a coordinate: a pair of numbers in parenthesis like this (x, y). The first data point for Seattle has the coordinate (1, 5.57), which means we find month 1 (January) on the x-axis, and from there we go up to 5.57 inches of rain on the y-axis.
Here is the data table that created the graph on the right. Do you see how the coordinates of each data point are determined?
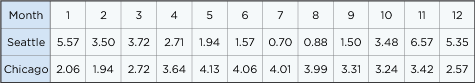
Source: National Climatic Data Center, 1981-2010 Climate Normals